
🌟 Trusted By 500+ Brands already
Heatmap Analytics – Find When Your Customers Are Most Active
No more guessing – see the true impact of your traffic, campaigns, and AI sources on revenue and conversions.
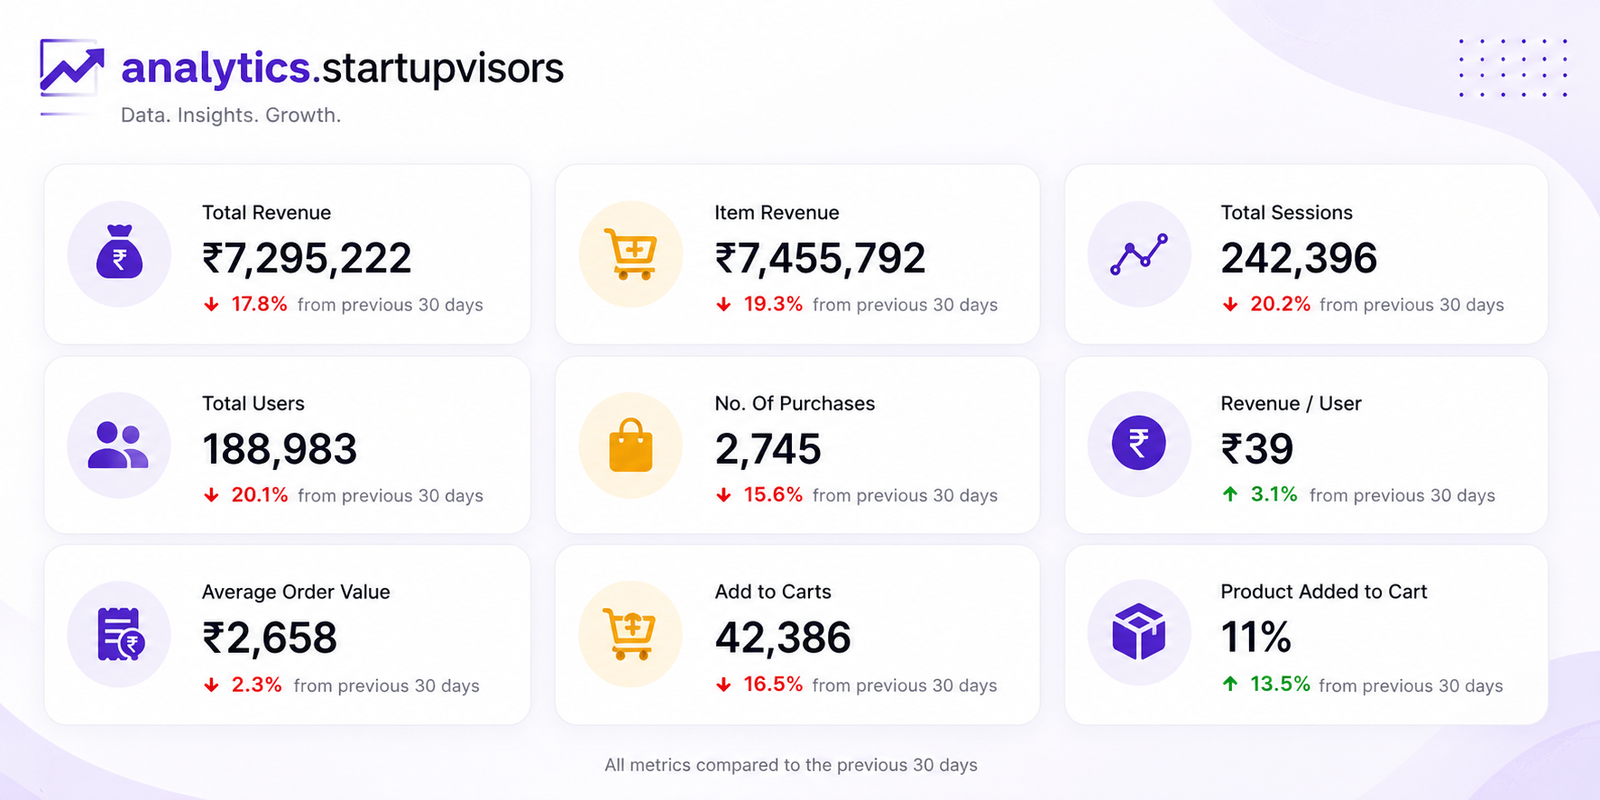
Built for the D2C Brands
Go beyond basic traffic reports with interactive heatmaps that reveal when, where, and how visitors engage with your store. Discover your peak shopping hours, busiest weekdays, and seasonal trends to launch campaigns, schedule promotions, and optimize staffing at the right time.

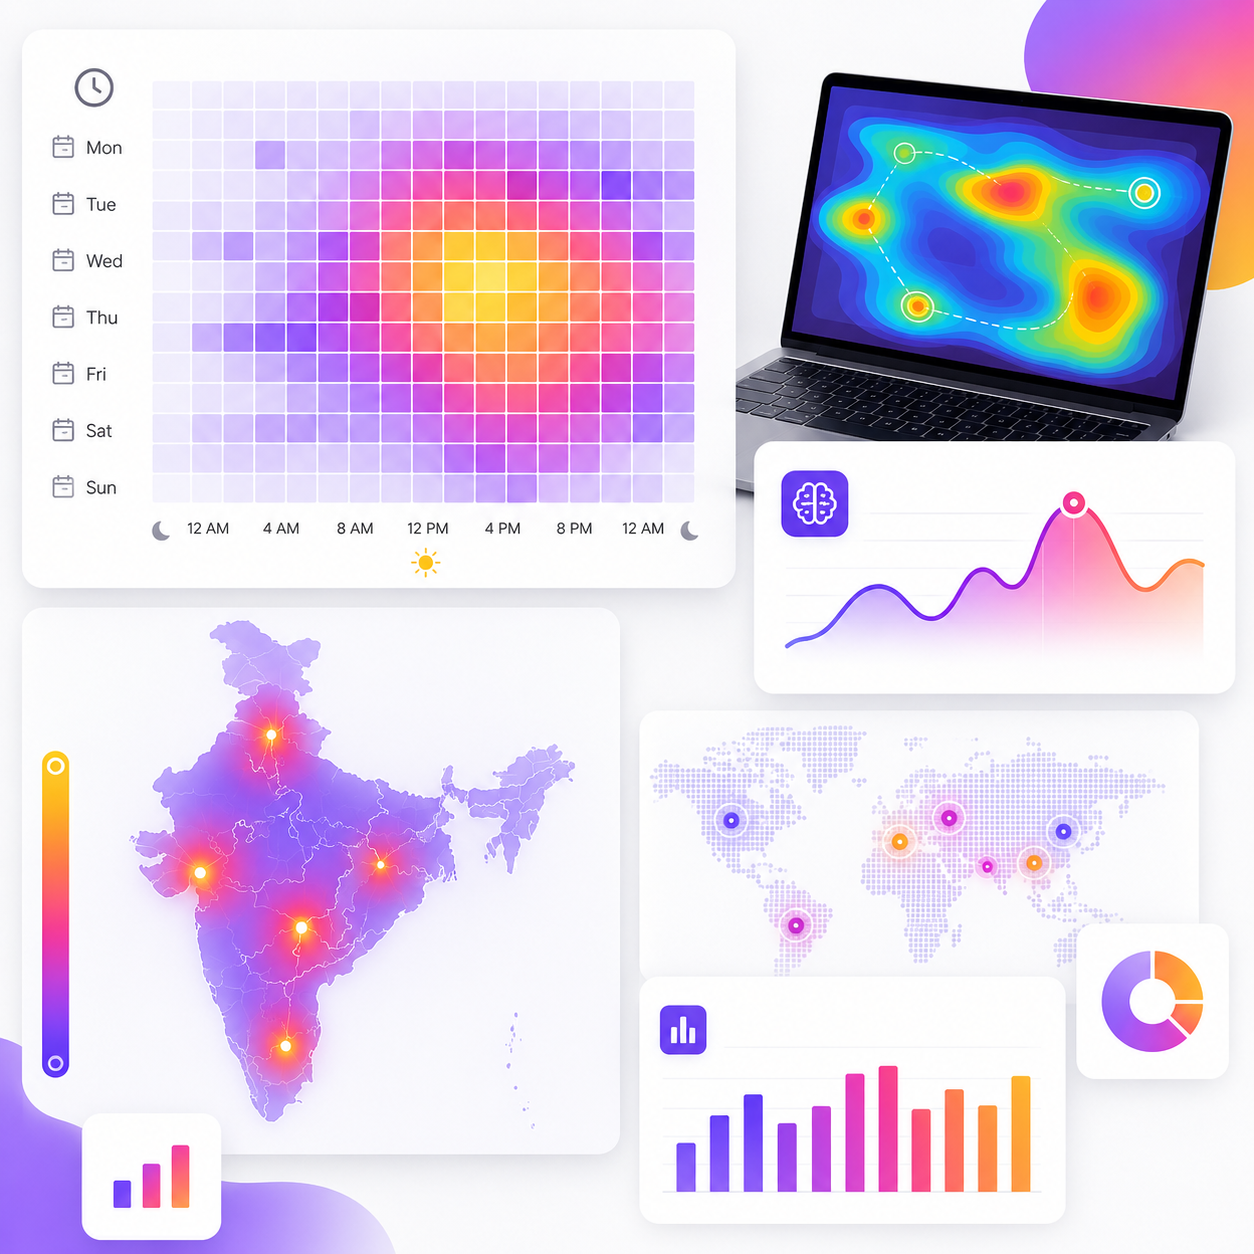
Visitor Activity Heatmap
Discover your busiest hours, days, and weeks to schedule campaigns, launches, and promotions when customers are most active.

AI Heatmap Insights
Receive AI-generated observations that highlight unusual traffic spikes, engagement trends, and actionable recommendations.

City-wise Heatmap
Visualize where your visitors come from with an interactive city-level map to uncover your strongest markets and identify expansion opportunities.

Built for D2C & E-Commerce
Purpose-built for online stores, with metrics and insights tailored specifically for D2C brands focused on performance and growth.
Features & Benefits
Analytics That Bring Clarity to Your D2C Growth
Transform your Google Analytics 4 data into easy-to-understand visual insights that help you identify trends, improve marketing performance, and make faster business decisions -all from a single interactive dashboard.
Plan Campaigns with Confidence
Schedule your marketing campaigns when your audience is most active to maximize engagement and conversions.
✔️Identify peak shopping hours and busiest days
✔️Launch email campaigns at the right time
✔️Schedule promotions and ads for maximum visibility
Spot Hidden Growth Opportunities
Uncover valuable visitor patterns and trends that are easy to miss in standard GA4 reports.
✔️Discover emerging high-performing cities and regions.
✔️Identify seasonal and weekly traffic patterns.
✔️Recognize growth opportunities before your competitors
Reduce Analysis Time
Skip complicated reports and access your most important insights through simple, interactive visualizations.
✔️Access your most important GA4 metrics instantly
✔️Eliminate hours of manual data analysis with visual dashboards.
✔️Focus more on decisions and less on data gathering
Improve Business Performance
Make smarter business decisions using actionable insights from your visitor behaviour and traffic trends.
✔️Optimize marketing budgets based on customer activity
✔️Improve inventory and staffing during peak demand
✔️Increase customer engagement with data-driven planning
Testimonials & Reviews
Join Our Satisfied Customers!
Outstanding Tool!
“The heatmap dashboard helped us quickly identify our busiest shopping hours without digging through multiple GA4 reports. The visual format makes it much easier to understand customer behaviour.”

Abhishek Sharma
Founder – India
Reduced Wasted Ad Spend
“The city-wise visitor analysis gave us a much clearer understanding of where our customers were coming from, helping us prioritize regional marketing campaigns.”
Emily Carter
Growth Lead – USA
Game-Changer for Our Business
“The AI insights highlighted traffic patterns that we hadn’t noticed before. We adjusted our campaign timing and saw better engagement within days.”
Neha Kapoor
Co-Founder – India
Easier to Understand
“The dashboard is clean, intuitive, and much easier to navigate than standard GA4 reports. Our team can quickly find the metrics that matter most.”
Jason Miler
Founder & CEO – USA
Clean, Actionable!
“Instead of spending time creating custom reports, we now have all the important insights available in one dashboard. It saves us a significant amount of time every week.”
Rahul Mehta
D2C Operator – India
Excellent Value for Money
“The combination of visual heatmaps and AI recommendations makes it easier to turn analytics into actionable business decisions without needing advanced technical knowledge.”
Daniel Rodriguez
D2C Founder – USA
FAQ
What insights does the Heatmap Dashboard provide?
The Heatmap Dashboard transforms your GA4 data into interactive visualizations, helping you understand visitor activity by hour, day, and location.
Can I filter the report by date or time period?
Yes. The report is fully date-filterable, allowing you to view performance for any custom date range, compare periods, and track growth or decline over time.
Do I need technical knowledge to use this dashboard?
Not at all. The dashboard is designed for marketers, founders, and ecommerce teams. Simply connect your GA4 property and explore easy-to-understand charts, heatmaps, and performance insights – no coding or analytics expertise required.
How often is the data updated?
Your dashboard displays the latest available data from Google Analytics 4. Most reports update automatically as new data becomes available in your GA4 property.
Can I analyze multiple websites or stores?
Yes. If you manage multiple GA4 properties, you can connect and switch between them to monitor the performance of different websites or ecommerce stores.
Who is this dashboard designed for?
The dashboard is ideal for Shopify stores, WooCommerce websites, D2C brands, startups, marketing agencies, and business owners who want actionable insights from their GA4 data without spending hours navigating complex reports.
Is my Google Analytics data secure?
Yes. Your data remains connected directly to your Google Analytics account. We don’t access and store your data
How much would it cost?
Simple, it’s free to view for everyone, If you want to download the reports or white-label the dashboard for your brand or agency – it’s a one-time USD 79 only.